Showing posts with label GLD. Show all posts

Tuesday, October 29, 2013

Michael Kosares: Screen-traded fiat gold could get very violent wake-up call GLD, MUX, TNR.v, GDX


  We have another article to share about the trade of the year with physical Gold flowing to China via multiple channels. With gold pushing five weeks high before FED meeting catalyst for higher prices could be just a few days ahead of us.

Peter Schiff: Fed Will Do The Opposite Of Tapering - More Money Printing! GLD, MUX, TNR.v, GDX


"Peter Schiff is very consistent in his views and even if his call for more QE sounds totally outrages do not discount it too fast. ZeroHedge reports that he is not alone in his observations. If it ever happens Gold will receive The Catalyst so many people are waiting for."

Peter Schiff On Gold Catalyst: Janet Yellen Exposed Part 2 - The Truth Behind the Myth GLD, MUX, TNR.v, GDX

 Market is already reacting to Janet Yellen's appointment to the FED chair - US Dollar is solidly below crucial 80.00 level and Gold and Silver are in breakout stage this week.


Gold COMEX Claims Per Deliverable Ounce Rises Above 55 at These Prices GLD, MUX, TNR.v, GDX


"Jesse reports about the ongoing Game of Musical Chairs in the Western Fractional Reserve Gold System with manipulated LBMA and COMEX Gold markets. With China taking now all physical delivery from the system the entire Western Gold market is under enormous pressure. 
  We found it very positive that with more unleashed attacks on Gold - in order to redeem physical Gold from GLD ETF holdings - it is more and more difficult for Gold market manipulators to keep it under $1300. Physical demand is pushing the price right back up. Goldman Sachs clients are not doing very well if they Sold their gold below $1300 following the House Gold Sell Call. This week we had a very impressive breakout in Gold, Silver and Gold & Silver mining stocks."


USA Gold:

Screen-traded fiat gold could get very violent wake-up call
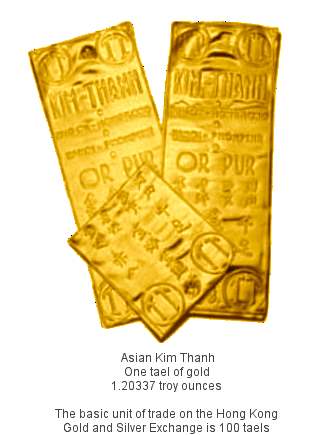

kim thnah
by Michael J. Kosares
“This could turn into a very violent wake-up call for [screen-traded gold]. People talk about ‘fiat currencies’, but we also have ‘fiat gold.’ Volatility is too cheap right now.” — Gold refiner quoted by John Dizard in his Financial Times column this weekend
In the initial Reuters report on the London-Zurich-Hong Kong-Shanghai gold pipeline, Macquarie gold analyst Matthew Turner suggested that the 1016 metric tonne United Kingdom export (up from 85 tonnes the previous year) might have been shipped to Switzerland for refining into “smaller bars more attractive to Asian consumers or to be vaulted there instead.” Though vaulting cannot be ruled out, the recasting explanation makes considerably more sense given the times and the extraordinary amount of gold being imported by China – over 1500 tonnes so far this year according to research published by the Koos Jansen website. It is difficult to imagine a scenario in which China would be interested in vaulting gold in the West – particularly at a time when the West is experiencing difficult financial and economic circumstances.
On the other hand, we know that four of the world’s top gold refineries are located in Switzerland — Valcambi, Pamp, Argor-Heraeus and Metalor. Roughly 70% of the world’s annual gold production is refined in Switzerland and it is considered the center of the world’s gold refinery business. Its bars are trusted on the world’s gold exchanges by the top banks, bullion dealers, jewelry manufacturers, and nation states alike. If Turner is right about recasting the bars into Asia-friendly units, and I think he is, Switzerland would be the place to do it, particularly in light of the volume reportedly being re-refined. In my view, China intends for this gold to be transported to and remain in the East otherwise it would not have gone to the trouble to have it recast into Asia friendly bars.
To gain a deeper understanding of what China might be up to, some background is essential. Let’s start with the trading units at the two major Chinese exchanges involved in the gold trade – the Hong Kong Gold and Silver Exchange and the Shanghai Gold Exchange (SGE) – because that goes a long toward explaining why the 1016 tonne export made an initial stop in Switzerland before moving on to China.
The tael is the standard unit of weight on the Hong Kong exchange. It equals 1.20337 troy ounces, or 37.4290 grams, fineness in the past has been 99% but this standard has been upgraded to 99.99% to conform to international trading standards. According to gold expert Timothy Green’s The Gold Companion (1991), the standard trading sizes on the Hong Kong exchange is five and ten taels. The basic contract is 100 taels, or 120.377 troy ounces, as opposed to the standard 100 troy ounce contract on U.S. futures’ exchanges.
The Hong Kong Gold Exchange is an outlet for much of Asia and the tael trading units, once again according to The Gold Companion are used in China, Taiwan, South Korea, Thailand and Viet Nam. The SGE is the only gold exchange in China and its contract-trading unit is the kilo bar (32.15 troy ounces), once again a significant deviation from the western exchange standard.
Dragon’s hoard includes Chinese people, Peoples Bank of China
Should this scenario prove to be accurate, most of the metal moving from London to Asia through Switzerland will more than likely end up in the hands of consumers in the form of jewelry and small bars. What few people realize is that all of this activity is fully sanctioned by the Chinese government and the Peoples Bank of China (PBOC). In fact, once again according to the Koos Jansen website, the Shanghai Gold Exchange is owned by the PBOC and as a result any gold imported and stored at the exchange for future delivery is, indirectly at least, gold inventory at China’s central bank. SGE widely publicizes itself as a “delivery market” thus the smaller and familiar kilo bar size as its chief trading unit makes a great deal of sense.
If, as the smaller bar sizes suggest, the UK-Swiss aspect of the pipeline functions as a bar resizing operation, then we may have a long way to go before China’s official sector (central bank) needs are satisfied simply because so much of it is going directly to Chinese consumers. It also implies that the demand we have already seen, as large as it is, could be just the tip of the iceberg. It is no secret that the Chinese people have a traditional, transcending attachment to gold. That same attitude, it should be kept in mind, permeates almost the whole of Asia, and as more and more people partake in the fruits of Asia’s rise economically the demand for gold is likely to grow with it. China is likely to take advantage of any drop in the price to load up as it did in the April-August, 2013 time period. In one of my early articles on China’s burgeoning interest in gold (June, 2009), I indicated that Chinese demand would likely put a floor under the market for many years to come. The statistics below bear that out.
Drawing again from the Koos Jansen analysis, the China Gold Market Report – authored by the key players in China’s gold market, including analysts for the SGE – lists the following distribution of physical metal through the Shanghai exchange in 2011:
456.66 tonnes – Jewelry manufacturing
53.22 tonnes – Industrial raw materials
21.55 tonnes – Gold coins
213.85 tonnes – Investment gold bars
13.52 tonnes – Other, unnamed industrial purposes
284.88 tonnes – Net investment (??) “…[D]emand arising from the transfer process of gold as an investment tool (This might be the portion that goes to central bank reserves.)
Total = 1043.68 tonnes
To offer a measuring stick that might give that number additional meaning – the total equals roughly 40% of annual mine production, one-eighth the U.S. gold reserve, and nearly one-third Germany’s reserve. (Keep in mind, too, we are talking 2011 numbers not 2013 numbers after the latest massive imports.)
Fiat currency, fiat gold
John Dizard’s column in this weekend’s Financial Times explores the unsettling developments in the physical gold market and what problems they might impose on the paper gold market. Though the column itself is a very positive one for gold’s prospects, it runs under a negative headline that has little to do with the content: Cry of negative gofo heralds trouble for gold. The words “paper traders” should have been added to end of the headline, because that is clearly the point Dizard is making.
He points to the very situation we have just covered in depth on the China connection, and talks about the shortage of kilo bars globally, the recasting of 400 troy ounce LBMA/ETF (exchange traded fund) bars, and the upside down forward rate on physical gold. Dizard poses the question, “Could the gold flow back from those kilo bars to recasting as good delivery 400oz bars?” In other words, does the London-Zurich-Hong Kong-Shanghai pipeline run in both directions? An unidentified gold refiner answers: “Much of that has been converted to jewelry. It would be a lengthy process. Those are pretty sticky hands…This could turn into a very violent wake-up call for [screen-traded gold]. People talk about ‘fiat currencies’, but we also have ‘fiat gold.’ Volatility is too cheap right now.”
Final note
One more point of interest before I put this piece of the China analysis to rest: HSBC, the multinational bank headquartered in London, is the chief storage facility for the largest gold ETFs. As mentioned in my previous article, much of the gold transferred to Switzerland by HSBC came out of the ETFs. In addition, HSBC is an important trading member in the daily London Gold Market Fixings. Founded by Sir Thomas Sutherland in the British colony of Hong Kong in 1865, HSBC stands for the Hong Kong Shanghai Banking Corporation."


Enhanced by Zemanta

Sunday, August 18, 2013

Adam Hamilton: Gold and GLD Exodus Reversal MUX, TNR.v


  After this week's fireworks in Gold and Silver market more and more letter writers will be crawling out of the rabbit holes to check out the damage to their reputation on the "ruins of The End of The Gold Bull" pronounced by bubble heads media this spring.


  We are following here only the best, who showed their knowledge through think and thin and did not change the position due to the fashion of the time. 
  It is important not to be blinded by faith in any investment and we are searching for the drivers for the next Bull Leg in Gold in economy, market technicals and fundamentals of supply and demand. 
  Adam Hamilton provides now a very compelling case for the General Equity Markets and GLD relationships and correlations and if you do not think that trees can grow straight up to the sky we are at the historical point in the markets development in the age of FED central planning now. 
  We have found our own story how to drive this Bull and following here McEwen Mining and transformation in TNR Gold among other stories. McEwen Mining is highly leveraged to silver and gold prices and TNR Gold now has a piece in the big action managed by Rob McEwen with its stake of one million shares in MUX and back-in right in the Los Azules Copper project. We hope that Adam Hamilton will be right again with his observations and these both stories will ride the Next Bull Leg In Gold market.


Rob McEwen: Gold prices are going up in September MUX, TNR.v, GLD

"Rob McEwen is bullish on Gold and his call about the bottom in the gold market has proven to be right so far. Silver action is particularly important for McEwen Mining now as it provides the very high leverage to its operations."

Rick Rule On Gold & Resources: "The Stage Is Set For An Absolutely Dramatic Recovery" TNR.v, MUX

 "After the years of training on our own mistakes we can tell you for certain that number one for us are the people behind the company. They are finding Capital, Projects and Make Things Happen. Stick with the best you can find, make sure that they have enough at stake in the particular company and check the vital signs continuously."

Kitco:

Friday August 16, 2013 16:10
The flagship GLD gold ETF has suffered a radically unprecedented mass exodus this year.  The capital fleeing this single vehicle was the primary reason gold plunged so dramatically in 2013’s first half.  But just this week, money started flowing back into GLD for the first time in months.  This likely marks the dawn of the GLD exodus’s reversal, which is wildly bullish for gold.  Falling stock markets will play a critical role.
The GLD gold ETF is now formally called SPDR Gold Shares.  Rising from modest beginnings nearly 9 years ago, it has grown into a dominant force in the global gold markets.  This is because GLD acts as a conduit for the vast pools of US stock-market capital to easily and quickly flow into and out of gold bullion.  These capital flows can greatly affect overall gold demand over short periods of time, buffeting gold’s price.
If GLD operated like a closed-end mutual fund, issuing a fixed number of shares one time at its IPO, this wouldn’t be the case.  GLD would have zero impact on the gold price after its initial bullion purchase.  But GLD isn’t structured this way, its primary mission is to track the gold price.  And there is only one way to accomplish this.  Both excess supply and demand of GLD shares have to be directly shunted into gold.
When stock traders get excited about gold, they buy GLD shares at a faster rate than gold itself is being bought.  Thus GLD’s price rises faster than gold’s, and it threatens to decouple to the upside and fail its mission.  In order to prevent this and bring GLD’s price back in line with gold’s, this ETF’s custodians have no choice but to meet this excess share demand.  So they sell new GLD shares into the market.
Selling new GLD shares naturally raises cash.  And the GLD custodians immediately plow these new funds into physical gold bullion held in trust for its shareholders in its London vaults.  This process effectively shunts excess GLD share demand into gold itself, amplifying the underlying gold rally.  So when stock traders are exerting differential buying pressure on GLD shares, it is very bullish for gold.
Ever since a gold ETF was conceptualized years before GLD was actually launched, both its advocates and opponents knew this tracking mission was a double-edged sword.  Stock traders wouldn’t always buy ETF shares faster than gold itself was being bought.  GLD would also face differential selling pressure from time to time, when its shares were being dumped faster than gold itself was being sold.
This reverses the bullion-holding process, pulling stock-market capital out of gold or effectively shunting stock-market GLD selling into gold.  When traders sell GLD faster than gold is being sold, there is excess supply of GLD shares.  So its price threatens to decouple to the downside and fail its tracking mission.  In order to avert this, GLD’s custodians have to quickly absorb any excess supply of GLD shares offered.
They raise the cash to buy back these shares by selling some of the gold bullion out of their vaults.  This of course increases the selling pressure on gold itself.  So just like GLD differential buying pressure can amplify gold uplegs, GLD differential selling pressure can amplify gold corrections.  Thankfully for gold bulls, we didn’t have to contend with a massive differential GLD selloff until this year.  Boy was it miserable!
This first chart looks at the total GLD bullion holdings in metric tons superimposed over the gold price.  GLD has always been extraordinarily transparent, publishing its total bullion holdings daily right down to the long list of serial-numbered individual gold bars.  GLD’s holdings offer a fantastic window into stock-trader gold sentiment, showing when American stock-market capital is flowing into or out of gold.
For fully 8 years after its inception, which conspiracy theorists went apoplectic over, GLD was hugely beneficial for the secular gold bull.  Stock-market investors and speculators alike bought GLD shares faster than gold was being bought, their capital literally flowing into this ETF’s underlying gold bullion as its custodians kept issuing new shares to maintain price tracking.  GLD has been a great boon for gold!
In any bull market, its existing investors want as much capital as possible to flow in and drive up the asset prices they are betting on.  The more the merrier, the more traders are bidding on an asset the higher its price ultimately goes.  GLD provided a wonderfully easy and efficient (very low transaction costs) way for stock-market investors and speculators to participate in the secular gold bull.  And participate they did.
There were naturally bouts of differential GLD selling pressure from time to time, as sentiment perpetually flows and ebbs.  Sometimes stock traders waxed bearish on gold and sold their GLD shares faster than the metal itself was being sold.  So GLD’s holdings dropped as its custodians sold gold bullion to absorb this excess supply of shares.  For lack of a better term, I call these episodes GLD holdingscorrections.
And for the most part they were relatively mild.  All of these significant GLD holdings corrections of its entire lifespan are noted in the chart above.  The blue number shows the percentage drop of GLD’s holdings, the yellow number the tonnage drop, the red number what gold prices did over that span, and the white number how long each correction took in months.  GLD holdings actually proved quite “sticky”.
This ETF would see big differential buying pressure in gold uplegs, forcing its custodians to shunt this new stock-trader capital directly into gold bullion.  But then when the inevitable gold corrections arrived, the differential selling of GLD shares was relatively minor.  Typical GLD holdings corrections ran from 4% to 7% of its holdings, and the absolute amounts of gold bullion sold weren’t too great for the markets to absorb.
There were occasional exceptions of course.  The biggest were during 2008’s once-in-a-lifetime stock panic, which also crushed gold through unprecedented US-dollar safe-haven buying.  GLD’s holdings plunged two separate times, by 12.6% and 13.0%.  And gold took big hits over these spans, down 13.3% and 22.0%.  This was partially because 83.4t and 91.6t of GLD’s bullion was sold back into the gold markets.
But both GLD’s holdings and the gold price quickly recovered from the stock-panic carnage in early 2009, when major hedge funds flooded into this ETF to take massive stakes in gold.  There was one more large GLD holdings correction starting in mid-2010, and it saw enough differential selling pressure to force GLD’s custodians to dump 9.8% of their bullion or 129.1t.  That was the most gold it had ever had to sell.
But provocatively gold’s price actually surged 20.6% higher over this record period of heavy GLD-share differential selling pressure!  Why?  Time.  That biggest absolute decline in GLD’s bullion held in trust for shareholders to that point took 10.6 months to unfold.  So there was plenty of time for GLD’s bullion sales to be absorbed by normal gold-market demand elsewhere.  The duration of holdings corrections is critical.
GLD’s holdings reached an initial record high of 1320.4 metric tons of gold bullion in June 2010.  Around that time, I was very blessed to enjoy a private lunch with GLD’s primary architect.  He was rightfully quite proud that his baby had facilitated way over 1000t of gold investment demand that likely wouldn’t have existed without GLD.  Large stock traders are just not interested in traditional gold-coin investing.
It is too inefficient, with transaction costs in terms of both time and money way too high.  A hedge fund that wants sizable gold-market exposure is not going to visit 100+ coin stores to find enough gold bullion to purchase, and then pay enormous premiums of 5%+.  GLD revolutionized gold investing for stock traders.  There is no doubt the vast majority of stock-market gold investment wouldn’t have happened without it.
After the summer of 2010, GLD’s holdings consolidated high for the next couple of years with gold prices.  There were some periodic draws, but these holdings corrections were minor.  Finally in September 2012 (QE3’s launch), GLD’s holdings started marching up to new record highs again.  By early December last year, merely a little over 8 months ago, they had climbed to a new all-time record high of 1353.3 tonnes.
Now on that very day, the gold price was still down 10.1% fully 15.6 months after its August 2011 secular-bull-to-date high.  At worst in gold’s massive correction out of very-overbought conditions, gold had fallen 18.8% by May 2012.  Yet GLD’s holdings remained high and stable throughout all of this gold carnage.  GLD looked to be held by strong hands, long-term investors who understood gold’s bullish fundamentals.
Up until February 2013, for GLD’s entire existence it had never witnessed any bouts of serious and sustained differential selling pressure other than 2008’s stock panic.  And GLD’s holdings recovered soon after that crazy event on strong differential buying.  What 2013 saw was impossible to foretell.
The tenth major holdings correction of GLD’s life slowly began in late December, and snowballed from there.  In the 8 months since, its holdings have plunged by 32.8%!  Even during the stock panic, the most frightening market event most of us alive today will ever witness, GLD’s holdings only fell by about 1/8th.  Yet this year, it has shed an astounding 1/3rd of its total gold bullion.  This is a staggering 444.0 metric tons!
In absolute terms, this was over 3.4x as much bullion as GLD’s custodians were forced to sell in its previous biggest correction!  It was 5.3x and 4.8x as big as the pair of stock-panic holdings corrections.  According to the World Gold Council, total global gold investment demand in 2012 was 1525.8t.  So seeing enough differential selling pressure to force GLD’s custodians to dump 29% of that was crazy.
This radically unprecedented mass exodus from GLD shares was beyond imagination, so far outside the realms of precedent set in the 8 years of trading before it.  I defy anyone to find a reputable gold analyst (not a broken-record perma-bear) that was on the record forecasting such an extreme event back in late 2012.  GLD had never experienced anything remotely like this epic 2013 holdings correction before.
So what the heck drove it?  I am all but certain the answer is the levitating US stock markets.  As far back as February, I was observing and writing about the new and incredibly high inverse correlation between the gold price and the mighty S&P 500 benchmark stock index (SPX).  The levitating stock markets seduced traders into believing gold was dead and general stocks would rise forever, so they dumped GLD.
This next chart digs into this thesis, and is pretty compelling.  It looks at GLD’s holdings over the past year superimposed on the SPX.  GLD’s draws (differential selling pressure) generally accelerated when the SPX was strong, and then moderated when it was weak.  If this causal chain is indeed correct, the long-overdue stock-market selloff is likely to reverse capital flows back into GLD.  This is wildly bullish for gold!
Late last year, the gold market and GLD demand were operating normally based on many years of secular-bull precedent.  Despite the stock markets being high in their nearly-4-year-old mid-secular-bear cyclical bull, capital was gradually flowing into gold.  Stock traders were steadily buying GLD, driving its holdings up to a new record high in early December.  But then an extraordinary series of events came to pass.
The SPX had stalled out in early April 2012, ready to roll over into its overdue cyclical bear.  For over 5 months the SPX couldn’t manage to claw its way to a single new cyclical-bull high, until September when first the ECB launched its own QE and then the Fed birthed its unprecedented open-ended third debt-monetization campaign.  The Fed went on to expand QE3 in mid-December to include US Treasury buying.
Stock traders saw the Fed single-handedly reignite the tired cyclical bull, and knew Bernanke had their backs.  The brutal fiscal-cliff tax hikes looming scared traders in late 2012, but when a deal was struck to avert the worst of them they started buying stocks.  The SPX began levitating to a long series of new cyclical-bull highs in January.  As bullishness ballooned, GLD owners started gradually selling to move capital into stocks.
This additional bullion selling began to weigh on gold, and it suffered a capitulation in February.  Even then it was readily apparent the levitating SPX was a major factor, as I wrote at the time.  That further spooked GLD shareholders, who ended up selling so much faster than gold was falling that this ETF had to liquidate 5.5% of its gold bullion (73.6t) in February alone just to buy back all the excess shares offered.
Though gold prices stabilized in March, averaging $1593, the differential GLD selling continued.  Why?  The SPX continued to surge dramatically.  Gold is and always has been an alternative investment, so when conventional general stocks are thriving interest wanes.  Day after day on CNBC and the rest of the financial media, the levitating stocks were euphorically extolled while gold was increasingly ridiculed.
Still, GLD’s holdings only fell by 2.6% or 33.2t in March as sentiment steadied.  But gold started to fall again in early April, partially on GLD selling.  Soon it broke below its critical multi-year support at $1550, spawning an ultra-rare forced liquidation of long futures contracts.  This triggered the sharpest gold plunge of our lifetimes, it looked like a gold panic.  While GLD selling didn’t drive this, it accelerated dramatically afterwards.
As GLD shareholders including elite hedge funds dumped it aggressively after that catastrophic 13.8% 2-day gold plunge, the SPX soon started surging again.  Ironically it had pulled back briefly on the fear that plummeting gold had wider implications.  The SPX surged dramatically in April to even more new cyclical-bull highs, and GLD ultimately suffered an outlying-record 11.7% draw that month of a staggering 142.7t!
As the SPX inexplicably continued levitating in May on pure euphoria, hitting 11 new record closes in 14 trading days, the differential GLD selling pressure continued.  Everyone thought gold was dead, the cool place to be was general stocks.  These big GLD draws didn’t slow until late May when the SPX finally started pulling back on a Fed QE3-tapering scare.  Look what happened to GLD draws during that pullback.
I shaded SPX pullbacks in red above.  The differential GLD selling pressure slowed dramatically as the general stock markets retreated.  The capital rotation out of GLD shares into general stocks stalled when the SPX started falling.  It didn’t start again in earnest until a third day of gold-futures forced liquidations was spawned by more Ben Bernanke QE3-tapering comments.  That reignited festering gold fears.
Soon after that, the SPX started surging again in July despite a mediocre-at-best Q2 earnings season.  As the SPX climbed to new nominal record highs, the differential GLD selling pressure continued.  Despite rampant general-stock euphoria though, the rate of GLD selling was slowing.  I suspect most of the weak hands had already sold.  A larger fraction of the remaining GLD owners are likely strong-handed investors.
Remember how sticky GLD’s holdings were in the 8 years before 2013?  Long-term investors, predominately institutions, were using this ETF for essential portfolio diversification into gold.  They had no reason to sell the metal, and ignored its periodic corrections.  Odds are very high that the great majority of GLD’s shareholders today fit that normal profile, that the hot money has already been squeezed out.
Then as the SPX started selling off again a couple weeks ago, the GLD draws again slowed and then stopped entirely.  We are seeing the same phenomenon that happened during the SPX’s last pullback.  The capital rotation out of GLD shares into general stocks looks far less attractive when the stock markets aren’t levitating day after day after day.  2013’s GLD mass exodus was driven by levitating stock markets!
So when the SPX inevitably reverses, which it is again way overdue for, odds are the capital flows out of GLD into general stocks will also reverse.  Add on all the other near-term bullish gold drivers like its emerging futures-driven short squeeze, and rallying gold prices are going to look far more attractive than falling stock prices.  And indeed we are already starting to see GLD differential buying pressure reemerge!
Both last Friday and this Wednesday, GLD experienced enough differential buying pressure to necessitate builds of 0.2% each day.  These are modest, but they are still noteworthy.  It is actually the first time in all of 2013 (actually since this massive holdings correction started in early December) that GLD has enjoyed two builds in less than a single week.  The GLD exodus reversal looks to be starting!
As of the GLD holdings low the day before that first recent build, 2013 had seen 152 trading days.  In a whopping 99 of these, nearly 2/3rds of all of them this year, GLD suffered draws.  It had only seen 7 days with enough differential buying pressure to drive holdings builds in all of 2013 to that point!  So to see a cluster in the past week is a major change.  I suspect the reversal has begun and will soon accelerate.
If you are interested in precious metals at all, you have to stay abreast of these GLD developments.  If the radically unprecedented GLD bullion selloffs that crushed gold in the first half of this year turn into GLD buying, the entire precious-metals complex is going to rocket higher.  Just this week much new data came out illuminating the GLD holdings correction during Q2 and how it affected global gold demand.
The bottom line is the incredible differential selling pressure GLD suffered in 2013 was radically unprecedented.  Nothing even remotely close had ever happened before, its holdings were actually very sticky before this anomaly.  It was spawned by the surreal stock-market levitation, which seduced capital out of GLD to chase general stocks.  Whenever the SPX weakens, this capital rotation slows dramatically.
With the SPX starting to sell off again, GLD is already seeing signs of a nascent reversal.  As gold climbs for other reasons and general stocks fall, capital is going to come flooding back into GLD.  This differential buying pressure will be shunted into underlying gold bullion, amplifying gold’s upleg.  Stock traders still need to buy back 437.6t worth of GLD shares to unwind 2013’s anomaly, which is wildly bullish for gold!


Enhanced by Zemanta