Showing posts with label Frank Holmes. Show all posts

Saturday, February 22, 2014

Frank Holmes: These Gold Charts Will Make Your Heart Beat Faster TNR.v MUX GDX GLD ABX GG RGLD


  Frank Holmes presents a very interesting set of charts supporting the bullish case for Gold and Gold stocks. Now with Gold crossing 200MA we have the game changer for the Gold marker. Professional traders have positioned themselves after 20MA was breaking out to the upside and smart money has followed after 50MA. Now the retail public will start buying the new Gold Bull leg.
  Number of Gold stocks with, McEwen Mining among them, has printed The Golden Cross already, when 50MA is crossing 200MA to the upside, confirming the bullish reversal pattern. It is very bullish set up and we expect the rally in Gold stocks to widen its base to include the smaller junior miners.


TNR Gold TNR.V is one of the most intriguing microcap stories I follow. cc:


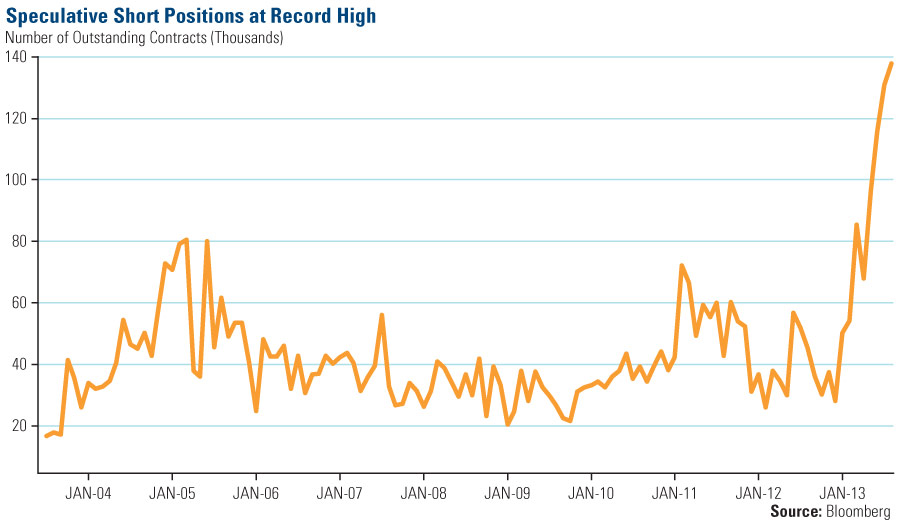
Gold Breaks 1,320: The Mother Of Short Squeeze Has Arrived TNR.v MUX GDX GLD SLV RGLD ABX GG

  "Gold is sending its Happy Valentines to all Gold Bugs today and breaks $1320 on the massive short squeeze. Gold shorts will have their Blood Friday now. The real reason for this move is the realisation of the groundbreaking shift in the structure of the Gold market with the unprecedented demand of 2,181 tons of Gold from China in 2013. Janet Yellen testimony has opened the possibility To Taper The Taper andJames Rickards is calling for the Taper Pause in June. US dollar is going down very close to 80.00 level again. This level will be protected, but should the US Dollar break down below 80.00 Gold and Silver will go vertical towards $1,500 and $25 respectively.
  Our short Squeeze watch includes McEwen Mining and TNR Gold. McEwen Mining had 26.8 million shares sold short or 8.6 days to cover, according to NASDAQ. MUX.to has rocketed from December low of CAD1.80 to CAD3.27 close yesterday. Gold breakout will push shorts into the corner, but explosive move in Silver will have even more effect on this company.
  TNR Gold is still day dreaming, but move in McEwen Mining should pull out this junior out of its misery. Los Azules Copper development will be next to watch on the back of recent M&A activity in the sector and CRB - commodity index breakout to the upside."


Frank Holmes:

These Gold Charts Will Make Your Heart Beat Faster


Gold lovers’ hearts beat faster last week, as the metal rose above $1,300 an ounce for the first time since November. The precious metal also climbed above its 200-day moving average, which hasn’t happened in about a year.
ISI’s John Mendelson noted that the generic gold future “rallied off its mid-December low and has decisively broken out above its downtrend line connecting the descending tops from late August, a near-term positive.” The next price he’s targeting is $1,350, the price gold was at in late October.
Gold Rises Above Its 200-Day Moving Average
So while gold may correct over the next several months as the metal enters its seasonally weak period of the year, this looks promising for gold investors.
Here are a few more gold charts that just might have your heart beating faster:
1. The Love Trade Endures in the East

In January, 246 tons of gold were withdrawn from the Shanghai Gold Exchange, as China continues expressing its love for the precious metal. This marks a record level of gold deliveries on the exchange as well as a significant increase over the same time last year.
In addition, you can see on the chart below that January’s total also exceeds world mining production for the month.
Chinese Demand for Gold Remains RobustAs Ralph Aldis likes to say, “Once the metal moves from the West and goes into China, we won’t get that gold back very easily.”
2. Money Supply Grew Faster in January

In the first month of 2014, the M2 money supply, which is a measure of money supply that includes cash, savings and checking deposits, grew faster than the previous two years. In 2012, M2 grew 7.6 percent and in 2013, money supply rose 4.7 percent; at an annualized rate, January’s money supply growth “reached an annualized rate of increase of 8.75 percent,” according to Bloomberg’s Precious Metal Mining team.
This may mean “the U.S. Federal Reserve is trying to resurrect inflation, thus increasing the appeal of gold, the supply of which can only increase about 1.5 percent to 2.5 percent annually,” says Bloomberg.
Increase in Money Supply Boosting Gold?Last year, gold started to take it on the chin when the real rate of return went from a negative 0.62 percent in March to a positive 0.54 percent by December. Like I told Jim Goddard from HoweStreet, a positive real rate of return is typically a major headwind for gold.
Between March and December of 2013, two things happened: 1) Yields rose in anticipation that the Federal Reserve would begin tapering its bond purchases, and 2) the consumer price index declined. However, going forward, I anticipate that CPI will increase, and, given the modest economic growth we’ve been seeing in the U.S. economy, interest rates won’t be able to rise too quickly.
3. Gold Stocks Poised to Rebound After Rare 3-Year Loss

What I think is tremendously powerful for gold stock investors is this chart. At the beginning of January, we took a look back at the annual returns for the Philadelphia Gold & Silver Index. In three decades, there were only three times that gold stocks only saw a consecutive 3-year loss.
Only 3 Times in 3 Decades Gold Stocks Declined 3 Consecutive YearsThese aren’t the only gold charts to love. See more in my latest presentation from the World Money Show.
By Frank Holmes
CEO and Chief Investment Officer
U.S. Global Investors"


Enhanced by Zemanta

Saturday, January 04, 2014

Frank Holmes: Gold Stocks - What to Expect in the New Year GLD, MUX, TNR.v, GDX, SLV


 Frank Holmes starts new year with the very insightful outlook for Gold and Gold miners. China buys record amount of Gold in 2013 and UK and German authorities are investigating Gold market manipulations now. Chances are that this manipulation can go forever with Gold flowing by tons from the West to the East. Chart above from KWN demonstrates that Gold is in the most oversold sate in its history now.


GATA: China Gold Chief Confirms Gold Price Suppression by U.S. MUX, TNR.v, GLD, GDX, SLV

GATA provides one more piece to our puzzle with Gold manipulation picture in place.


Bill Murphy: JPMorgan Silver And Gold Scandal Will Be Exposed GLD, MUX, TNR.v, GDX

 "We continue our research on Gold and Silver manipulations and this year has already provided us with a lot of revelations on this topic. So far China has benefited the most buying record amount of Gold at the artificially suppressed price levels."


Rob McEwen: “The Next Run Will Be Driven By Gold Moving Higher, As Well As New Discoveries” MUX, TNR.v, GDX, GLD

 "Rob McEwen gives his view on the Gold market and what will be the driving force behind the next Bull Run. He is looking for the deals in this market environment and that new discoveries will be driving the successful companies backing them. Meanwhile Gold is under pressure today testing the recent lows. Equity markets are drifting lower and Interest Rates higher. Rob reminds us, that turnaround can be very fast as we saw this summer after Gold has bottomed out and miners were spiking up. Equity markets are very high now and Gold sector is very undervalued, people will start looking at the relative values at these levels."

U.S. Global Investors:


Gold Stocks: What to Expect in the New Year


January 3, 2014
By Frank Holmes
CEO and Chief Investment Officer
U.S. Global Investors
Where-Will-Gold-Head-in-2014
After three years of pain, can gold stocks break their losing streak and see a gain in 2014?
History says chances are good.
The most recent string of losses in the gold mining industry has been brutal, causing many investors to give up on the sector and sell their holdings. Since the beginning of 2011, the NYSE Arca Gold Miners, the FTSE Gold Mines, and the Philadelphia Gold & Silver Indices all declined more than 60 percent.
But ditching this sector may not be the best action to take this year because miners are approaching the historical limits of multi-year declines.
Take a look at the Philadelphia Gold & Silver Index (XAU) during prior periods of stress. While gold stocks have a history of higher volatility compared to the overall U.S. market, consecutive periods of declines are rare. In 30 years, the XAU never had a losing streak of more than three years.
In fact, there were only two previous times in these three decades in which the XAU saw a trio of losses.
One was back in the early 1990s, when the index fell 19.09 percent, 16.75 percent and 11.75 percent in 1990, 1991 and 1992, respectively.
What’s striking about this period is the incredible rebound that followed. The XAU rallied 85 percent in 1993. U.S. Global Investors’ Gold and Precious Metals Fund (USERX) climbed even more, increasing a whopping 124 percent in 1993. See recent performance of USERX.
Could we see a repeat performance?
Perhaps. A key is watching government policies, as they can be a precursor to change.
Let’s take a look at the other period of weakness. This three-year loss occurred in the late ‘90s, with a muted rebound in 1999. However, at that time, the Bank of England (BOE) was auctioning off a significant amount of its gold reserves when bullion prices were at their lowest in 20 years. From 1999 to 2002, the central bank in England sold off 400 tonnes at a value of about $3.5 billion.
If the BOE had held onto this gold, it’d be worth nearly $15.9 billion today.
Following the period when the BOE sold its gold, the XAU rebounded. While the index gained only about 6 percent in 2001, gold stocks rose 41 percent in 2002 and about 42 percent in 2003.
During this period, gold and gold stocks were again influenced by a change in government policy. In this case, the liberalization of gold purchases was occurring in China, which was positive for gold.
So what about 2014?
What catalysts could turn gold stocks around and end the losing streak? Investors have multiple possible events to choose from that could cause gold and gold companies to rally. In a recent Mineweb article, Lawrie Williams listed several:
  • Gold ETF sales have slowedSee our chart that shows how gold ETF redemptions ceased to be the main driver of falling prices.
  • The COMEX warehouse is “running out of available physical gold,” which is causing more traders to demand delivery of additional gold, says Lawrie.
  • China may continue to build its gold reserves. Lawrie speculates that China could have its first gold conference backed by “a slew of government organisations.”
  • India could ease its gold import restrictions. Last week in the Investor Alert, we highlighted the commerce ministry’s request to ease restrictions, which would relieve jewelers hurt by import curbs.
  • Unrest in the Middle East likely could persist.
  • There may be a “major hiccup” in U.S. growth. Read U.S. Global’s special report, which takes a closer look at how to evaluate unemployment and inflation numbers.
  • Newly mined gold supply may be underwhelming.
Lawrie mentions a few downsides as well, which would result in an unprecedented fourth year of declines for gold stocks. For example, as the Federal Reserve cuts back on bond purchases, it could come “without adverse general stock market reaction.” In addition, there may continue to be improvements in the unemployment situation in the U.S. and Europe.
Ralph Aldis, portfolio manager of U.S. Global’s gold funds, the Gold and Precious Metals Fund (USERX) and the World Precious Minerals Fund (UNWPX), believes the best time to buy gold is when the market hates it. He recently talked with The Gold Report about gold, junior explorers and what investors should expect in the new year. When asked his thoughts about gold’s direction in 2014, Ralph remarked:
I think pessimism has reached a maximum, particularly in the gold space. Historically, when pessimistic consensus is this strong and gold stocks are hated this much, these are turning points.
The opportunity is here; don't get discouraged.


Enhanced by Zemanta

Wednesday, August 21, 2013

Frank Holmes: What Happens When You Tell Indians to Stop Buying Gold


  Frank Holmes provides very important observations for the Gold demand from India in light of all restrictions imposed by the Indian Central Bank.


Frank Holmes: Commodities 2013 Halftime Report: A Time to Mine for Opportunity?

"Frank Holmes makes a few very interesting observations on Commodities and Gold. We highly recommend to revisit his big picture presentation below:"

McEwen Mining Inc.: El Gallo Regional Exploration; Twin Domes Drilling Intersects Significant Near Surface Gold Mineralization MUX, TNR.v

 "Rob McEwen delivers new explorations results from his new Twin Domes discovery in Mexico."

Kitco:

What Happens When You Tell Indians to Stop Buying Gold


Tuesday August 20, 2013 11:46
Love Trade Holds Its LusterIndia’s demand for gold during the second quarter of 2013 topped all other countries, according to the latest World Gold Council data. As noted by GoldCore, the demand for gold in India rose to its “highest in the last 10 years,” with jewelry, bars and coins demand, capping 310 tons during the period.
You can see India isn’t the only country in the East enamored with gold. I’ve discussed many times how China’s love for physical gold has endured, as gold deliveries on the Shanghai Gold Exchange climbed to record levels and jewelry stores were flooded with buyers in Beijing, Shanghai and Guangzhou.
Now the World Gold Council (WGC) confirms that in the second quarter, 60 percent of jewelry demand and almost half of all bar and coin demand came from these two countries alone!
European Consumer confidence on the Rise

While financially traded gold, i.e., ETFs, experienced redemptions, physical gold was in strong demand. Besides Chindia, people in the U.S., Europe, Turkey and the Middle East purchased tons of gold jewelry, bars and coins.
This tells us that the Love Trade shines on. Like gold, the Love Trade doesn’t tarnish; it holds its luster.
In India, the Love Trade holds steady in spite of the government imposing import tax hikes on gold in an attempt to reduce the country’s current account deficit. In fact, according to the WGC, gold jewelry, bar and coin demand in India alone was 70 percent stronger in the second quarter of 2013 compared to the same quarter last year.
When the increased duties were implemented, I was skeptical that gold demand would be curtailed because of India’s affinity to the precious metal.
For decades, Indian families have celebrated weddings, births, festivals and holidays centered on gold and these traditions are passed down from generation to generation. Take the wedding industry, for example, where about half of the gold that Indians buy each year is for a wedding. With an estimated 10 million weddings taking place every year in India, the country sees a lot of gold buying out of love.
That’s according to a 60 Minutes feature on the role of gold in India’s wedding industry. If you missed it, the link is on our website.
India’s culture is very different from that of many Western countries. I’ve been to many Indian weddings and have witnessed this special and unique celebration as well as a very tight bond among families. I’m excited to be attending another wedding this November while I am in Delhi at a global CEO summit.
However, the record gold buying we are seeing today isn’t only out of love. I believe Indians are also buying out of fear due to its infamously poor and corrupt government policies.
I often say how government policies can be precursors to change. Good policies can drive economic growth and markets respond positively. Bad policies can have the opposite effect. At the same time Indians buy gold out of love for their family and close friends, they are also buying gold out of protection.
Take a look at the chart below, which shows gold’s return in Indian rupee compared with gold’s return in the U.S. dollar. In the U.S., where the dollar has strengthened, gold has increased only 12 percent on a cumulative basis over the past three years. But in a country with a significantly weakening currency, gold gained nearly 50 percent.
PMI Leading indicator for European Earnings-Per-Share

With the government in India recently raising its import tax for gold to 10 percent, I firmly believe Indians will continue indulging in gold, even if they have to smuggle it in.
We’ll see if Delhi gets its way, especially as gold is approaching its prime seasonal time. I noticed on Business Insider that JP Morgan expressed a similar thought: “Indian demand is quite seasonal related to events and festivals. While some might argue for less Indian buying due to tougher regulations and the weaker rupee making the metal more expensive, the WGC data suggests the opposite."
Europe is trading Close to Record Low Based on Normalized Price-to-Earnings

When I was on Bloomberg Radio and CNBC in August, the anchors were asking me about gold’s movements and if investors should follow the gold buying patterns of George Soros and John Paulson.
These hedge fund managers are making huge short-term bets, which is a very different strategy from what I’ve suggested. I have always advocated holding gold like insurance, with only a 5 to 10 percent weighting in gold and gold companies, and rebalancing annually.
All opinions expressed and data provided are subject to change without notice. Some of these opinions may not be appropriate to every investor. The commentary references the investment theory of an investment as insurance against a separate market event that could negatively affect performance of an investment. The reference does not guarantee performance or a safeguard from loss of principal by investing in that asset. By clicking the links above, you will be directed to third-party websites. U.S. Global Investors does not endorse all information supplied by these websites and is not responsible for their content.
By Frank Holmes,
CEO and Chief Investment Officer
U.S.Global Investors"

Enhanced by Zemanta

Thursday, July 18, 2013

Frank Holmes: Commodities 2013 Halftime Report: A Time to Mine for Opportunity?


  Frank Holmes makes a few very interesting observations on Commodities and Gold. We highly recommend to revisit his big picture presentation below:


Frank Holmes: Follow The Money - Warren Buffett vs. Gold


Kitco:

Commodities 2013 Halftime Report: A Time to Mine for Opportunity?


It was a challenging first half of the year for most commodities, with only two resources we track on our Periodic Table of Commodities Returns rising in value. Natural gas and oil rose 6.5 percent and 5 percent, respectively, while silver lost a third of its value and gold lost a quarter of its price from the beginning of the year.
Seculative short positions at record high
At first glance, the correction seems to support naysayers who believe the supercycle in commodities has ended, such as Credit Suisse analysts, who had declared that the “era is over,” in its digital magazine, The Financialist.
We disagree. Instead, we see severe price declines as possible buying opportunities during this ongoing commodity supercycle.
Consider the extreme pessimism on gold. As one measure of how bears have ganged up against the yellow metal, take a look at the spike in the level of short positions on the precious metal since the beginning of the year. As of the beginning of July, the number of outstanding gold short contracts was close to 140,000!
Seculative short positions at record high

In June, while I was on CNBC’s Squawk Box, Howard Ward, the chief investment officer of GAMCO Investors, made a bullish call based on the severity of the speculative short position:
“It was off the charts, just like it was a week ago for the short position and the yen, the pound and euro. Well, we’ve seen what happened to that. You wanted to be on the other side of that trade. I’ll take the other side of the gold trade as well. Whenever so many people are on one side, I will take the other side. I think gold probably rallies between here and the end of the year.”
There is certainly a pervasive sense of doom and gloom not only for gold, but for the entire resources space. BCA Research’s Commodity & Energy Strategy report points to a recent Bank of America-Merrill Lynch fund manager survey, which shows that exposure to commodities is as low as it was at the end of 2008. The firm’s first-hand experience reveals a similar investor reaction to resources: “Recent client visits to Europe, Australia and Asia confirm widespread pessimism towards the outlook for ‘anything outside the U.S.,’” says BCA.
This is all music to a contrarian’s ears because it’s another sign of a bottom, but BCA advises taking a “patient approach to front-running the eventual cyclical rally in commodities.” It’s all about your time horizon, says the firm.
Supercycles are not short-term; rather, they are long, continuous waves of boom and bust that can last several decades. While the overall trend is up, there are often short-term bursts of volatility. And looking over the next decade or so, the trends driving the current commodity supercycle remain in place.
I recently read an insightful report on the subject from ETF Securities. In it, analysts highlight two primary long-term drivers.
One entails the urbanization and industrialization trends that are “resource-intensive,” specifically, those found in emerging markets with large populations. Take their energy use, for example, which is “only a fraction of the developed world equivalent,” says ETF Securities. Developed markets, including Australia, France, Germany, Japan and the U.S., all have a higher GDP per capita as well as greater energy use than the emerging markets of Brazil, India, Mexico and China. These countries have significantly large populations, and “a relatively modest rise in per capita energy use will transform into a large absolute increase in global energy use.”
Huge potential increase in energy use from emerging markets
According to ExxonMobil’s 2013 “Outlook for Energy” report, the energy demand in developing nations “will rise 65 percent by 2040 compared to 2010, reflecting growing prosperity and expanding economies.”
The second driver of the supercycle is the rising cost to produce many commodities, says ETF Securities. I’ve discussed on numerous occasions the difficulties facing gold miners, which have seen lower grades and a lack of discoveries. This has made mining the yellow metal more expensive. And, as I indicated in a recent post, with a lower gold price, miners are rethinking projects that are too costly.
With many other commodities, resources companies are increasingly facing labor strikes, increased taxes and a backlog of projects that ultimately drive up the cost to mine and produce.
We agree with ETF Securities that the supercycle in commodities is alive and well. We are also in agreement with Credit Suisse when the firm explains that “the prices of individual commodities will no longer rise and fall together as they have for the last five years.” Instead, investors “are going to have to focus on the specific supply and demand dynamics for individual commodities.”
In this environment, an active manager with a wealth of experience can thrive. In our experience, commodity prices can move quickly and an active manager is able to tactically shift assets into areas of opportunity.
So, instead of trying to guess which commodity will outshine all others, we suggest diversifying across all commodities to try to smooth out the inherent volatility. See the approach that the Global Resources Fund (PSPFX) takes here.
And when it comes to gold, my position remains: Maintain a 5 percent weighting in gold bullion and a 5 percent weighting in gold stocks, selling when the price moves up significantly and buying when the opportunity presents itself.
By Frank Holmes,
CEO and Chief Investment Officer
U.S.Global Investors
All opinions expressed and data provided are subject to change without notice. Some of these opinions may not be appropriate to every investor. Diversification does not protect an investor from market risks and does not assure a profit.
Foreign and emerging market investing involves special risks such as currency fluctuation and less public disclosure, as well as economic and political risk. Because the Global Resources Fund concentrates its investments in a specific industry, the fund may be subject to greater risks and fluctuations than a portfolio representing a broader range of industries."

Enhanced by Zemanta